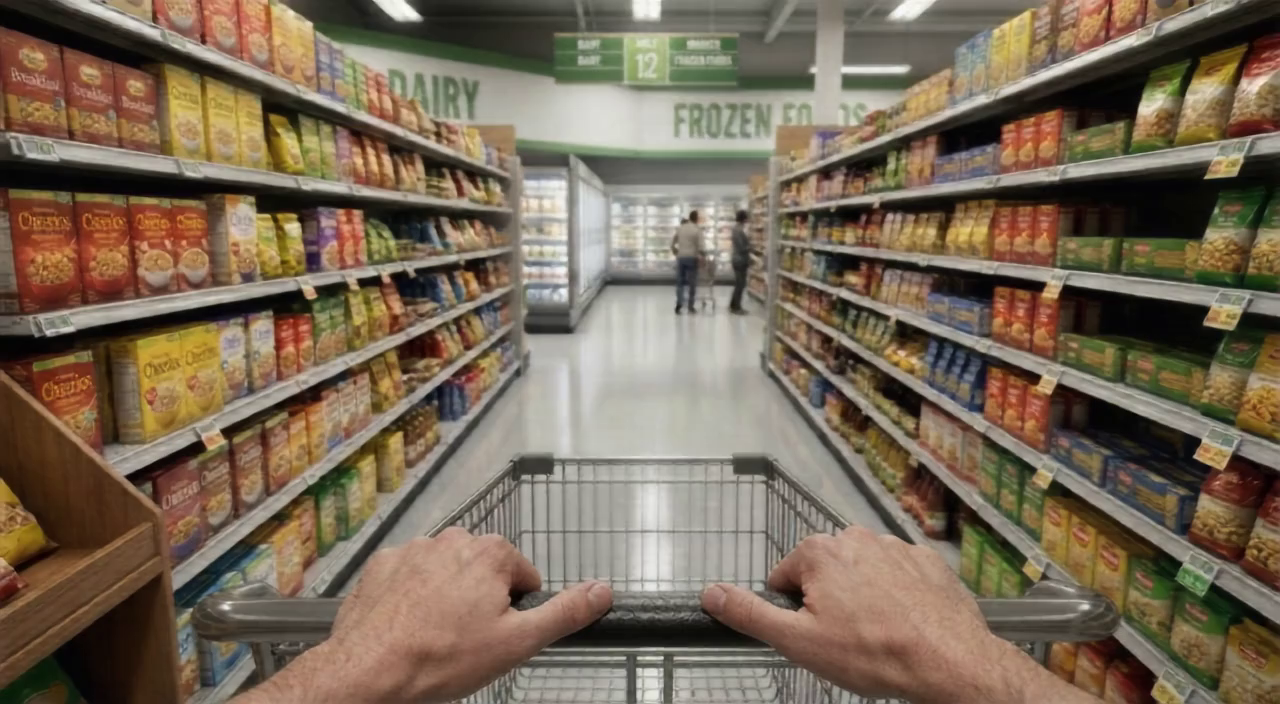
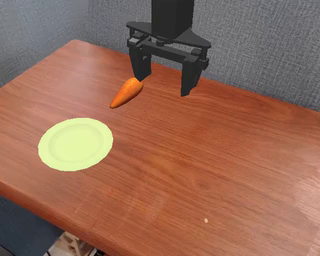
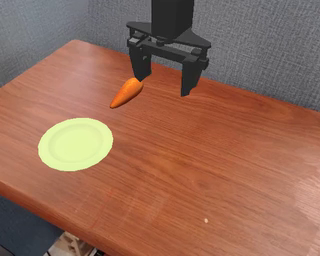
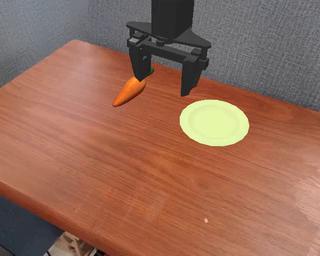
Examples stay in their registered order. Every seed and any failed runs remain in the full results.
Compare the numbers across every run
Matrix-Game 3 Base − Matrix-Game 3 Distilled. Uses every jointly scored case and seed for these two configurations, across the full study.
Difference between matched runs · 95% confidence intervals
Measurement
Left − right
95% interval
Paired coverage
Action responsepercentage points
-0.3
-0.4 to -0.1
48 matched pairs8 groups · 0 excluded pairs
Return similaritySSIM
+0.058
+0.016 to +0.108
48 matched pairs8 groups · 0 excluded pairs
Generation timeseconds
+639.9
+636.1 to +644.3
48 matched pairs8 groups · 0 excluded pairs
Motion while idlepixels / frame
-0.002
-0.004 to -0.001
48 matched pairs8 groups · 0 excluded pairs
Frozen during inputpercentage points
0.0
No variation in resamples
48 matched pairs8 groups · 0 excluded pairs
Tracking coveragepercentage points
-0.8
-1.8 to -0.2
48 matched pairs8 groups · 0 excluded pairs
Offline throughputframes / second
-3.903
-4.068 to -3.748
48 matched pairs8 groups · 0 excluded pairs
Warm generation costUSD / clip
+0.709
+0.705 to +0.714
48 matched pairs8 groups · 0 excluded pairs
A positive difference means the left model has a higher value; a negative difference means a lower value. Whether that is better depends on the metric. Excluded pairs include inapplicable or unscored measurements. These differences use matched runs and can differ from subtracting the displayed averages. Intervals that cross zero do not establish a clear direction of difference.
The camera holds until 3.56s, turns for 2.5s, receives the opposite input for 2.5s, then holds again from 8.56s. Compare the view before the turn with the ending view. Identical controls do not guarantee identical camera motion.
All measurements and coverage · 95% intervals where available
Model configuration
Action response% · higher is better
Return similaritySSIM · higher is better
Generation timeseconds · lower is better
Motion while idlepixels / frame · lower is better
Frozen during input% · lower is better
Tracking coverage% · higher is better
Offline throughputframes / second · higher is better
Warm generation costUSD / clip · lower is better
Run errors / runs
Matrix-Game 3 Base
99.599.3–99.68 groups · 48 scored runs
0.2150.148–0.3048 groups · 48 scored runs
683.7680.3–687.48 groups · 48 scored runs
0.0170.015–0.0198 groups · 48 scored runs
0.0No variation in resamples8 groups · 48 scored runs
0.0No variation in resamples8 groups · 48 scored runs
98.796.7–99.98 groups · 48 scored runs
4.1624.007–4.3268 groups · 48 scored runs
0.0490.046–0.0528 groups · 48 scored runs
0 / 48
Matrix-Game 2 Universal
100.0No variation in resamples8 groups · 48 scored runs
0.1350.085–0.2098 groups · 48 scored runs
11.311.1–11.68 groups · 48 scored runs
0.0120.009–0.0148 groups · 48 scored runs
0.0No variation in resamples8 groups · 48 scored runs
96.693.8–99.18 groups · 48 scored runs
15.74715.402–15.9868 groups · 48 scored runs
0.0120.012–0.0138 groups · 48 scored runs
0 / 48
Frozen imagebaseline
0.0No variation in resamples8 groups · 48 scored runs
1.0001.000–1.0008 groups · 48 scored runs
Not availableInterval unavailable0 groups · 0 scored runs
0.000No variation in resamples8 groups · 48 scored runs
100.0No variation in resamples8 groups · 48 scored runs
100.0No variation in resamples8 groups · 48 scored runs
Not availableInterval unavailable0 groups · 0 scored runs
Not availableInterval unavailable0 groups · 0 scored runs
0 / 48
Means weight each registered scene/group equally. 95% percentile intervals use 2,000 group bootstrap draws, seed 20261015. Repeated seeds stay within groups. Paired differences use jointly scored attempts; excluded pairs and all failures are reported. These intervals do not measure evaluator bias.
When every resample gives the same result, the interval cannot describe unseen successes or failures. No observed variation does not establish certainty.
Known +/-3-pixel and stationary transformations passed on all 8 images (24/24); textureless frames correctly remain undefined. Full 177-frame synthetic control and frozen-baseline checks passed for all 8 images. A native Matrix-Game 2 probe was also visually audited. This does not validate semantic memory or metric bias on every generated artifact.
Action response. Fraction of reliably tracked turn-phase frame pairs moving in the requested image-plane direction by more than 0.25 pixels. Undefined below 50% tracking coverage.
Return similarity. Mean grayscale structural similarity between eight pre-turn and post-return frames at 640x352. Static video can score perfectly; inspect action response alongside this metric.
Generation time. Synchronized native pipeline wall time for 177 frames, including native preprocessing and video writing but excluding checkpoint loading and installation. Offline timing, not serving latency.
Motion while idle. Median robust image-plane displacement during no-input phases, at 640x352. Dynamic objects and estimator failure can affect this proxy; undefined below 50% idle-pair coverage.
Frozen during input. Fraction of turn-phase pairs with mean grayscale absolute difference below 0.25 intensity units. Measures frozen output, not 3D movement correctness.
Tracking coverage. Fraction of turn-phase frame pairs yielding at least 20 consistent optical-flow/RANSAC inliers. Low coverage can bias action response and must stay visible.
Offline throughput. 177 decoded frames divided by synchronized native pipeline duration, including writing output videos. Excludes model loading; not an interactive streaming measurement.
Warm generation cost. Native generation duration times the recorded GPU hourly rate. Excludes cold setup, model loading and local scoring; total study cost includes the rental overhead.
Eight selected scenes do not establish broad generalization.
Image-plane motion and return-view SSIM are diagnostic proxies, not physical state or semantic-memory ground truth.
Dynamic objects, low texture and scene changes can make motion estimation undefined; coverage and missing values must be reported.
Equal and opposite native mouse input requests a return, but does not guarantee the generated camera actually returns.
The frozen baseline intentionally scores highly on return similarity while failing action response.
This is a new Rather protocol using licensed WBench images, not a WBench leaderboard score.
Offline generation timing is not end-to-end interactive service latency.
Three configurations of one Skywork model family, not broad provider coverage.
Released native resolutions differ. Image-plane metrics use the same 640x352 canvas; compute results describe each native configuration, not equal-resolution ablations.
Matrix-Game 3 uses explicitly recorded PyTorch 2.8 / Flash Attention 2 instead of the upstream Torch 2.10 pin, with unchanged pinned model code. This runtime passed native generation probes.
The museum left-return scene was used in one Matrix-Game 2 connector probe with a different seed. All images were used for metric calibration; no held-out-development claim.
The 11.06-second horizon checks a short camera-return interaction, not long-horizon memory. No semantic, 3D-state, real-time-serving or physical-consistency claim is made.
Frozen-image output is reused across seeds and does not add independent baseline repetitions.
Browser previews are 640x352 VP9 derivatives. Original native-resolution MP4s remain linked; all image-plane measurements use the registered canonical 640x352 canvas.
GPU class is matched across configurations. Host CPUs, filesystem and shared-resource contention are recorded where available but not controlled; timings include native preprocessing and video writing.
One worker failed during dependency installation before loading a model. A recorded setup-only amendment completed that shard with unchanged model code, inputs and seeds; the failed setup log and cost remain in the execution ledger. No model inference attempt was repeated.
One NVIDIA H100 80GB HBM3 (SXM) per worker, same hardware class for all three model configurations; CPU scoring is separate. · $50.83 · Estimated GPU rentals including setup, failed probes and cancelled compilation; excludes storage, egress, tax and local CPU scoring. Ledger: Open execution and cost records ↗ (opens in a new tab)
Eight preselected first-person navigation images from the MIT-licensed WBench dataset, pinned to its recorded revision and attributed to WBench authors / Meituan LongCat and Fudan University. New Rather controls and measurements; not an official WBench result.