Predicting a pickup · Robot simulation
Will the robot keep hold of it?
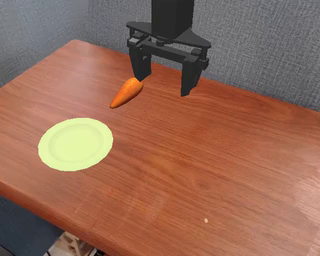
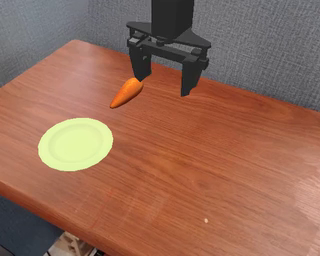
Watch two AI predictions beside what actually happened in the simulator.
Clip files & individual measurements
Cosmos 3 Edge
NVIDIA
- Outcome agreement
- 100.0 %
- Readable outcomes
- 100.0 %
- False successes
- Reference outcome makes this error type inapplicable.
- Missed successes
- 0.0 %
- Generation time
- 9.8 seconds
Cosmos 3 Nano
NVIDIA
- Outcome agreement
- 100.0 %
- Readable outcomes
- 100.0 %
- False successes
- Reference outcome makes this error type inapplicable.
- Missed successes
- 0.0 %
- Generation time
- 11.5 seconds
Each clip shows one registered input and seed. The full study includes every seed and failure.
Look for thisWatch the carrot as the gripper closes and lifts. Does it stay off the table at the end?
Every run, including failures (data file) (opens in a new tab)
Choose a scene or change the models
Examples stay in their registered order. Every seed and any failed runs remain in the full results.
Compare the numbers across every run
Cosmos 3 Edge − Cosmos 3 Nano. Uses every jointly scored case and seed for these two configurations, across the full study.
| Measurement | Left − right | 95% interval | Paired coverage |
|---|---|---|---|
| Outcome agreementpercentage points | -0.1 | -4.5 to +4.2 | 88 matched pairs6 groups · 8 excluded pairs |
| Readable outcomespercentage points | +4.6 | +1.4 to +8.3 | 96 matched pairs6 groups · 0 excluded pairs |
| False successespercentage points | 0.0 | No variation in resamples | 41 matched pairs6 groups · 55 excluded pairs |
| Missed successespercentage points | 0.0 | -6.7 to +6.7 | 47 matched pairs5 groups · 49 excluded pairs |
| Generation timeseconds | -1.8 | -1.9 to -1.7 | 96 matched pairs6 groups · 0 excluded pairs |
A positive difference means the left model has a higher value; a negative difference means a lower value. Whether that is better depends on the metric. Excluded pairs include inapplicable or unscored measurements. These differences use matched runs and can differ from subtracting the displayed averages. Intervals that cross zero do not establish a clear direction of difference.
This is a simulated robot, not a physical trial. Generated-video outcome labels have not had independent human validation.
Results corrected on 2026-10-16
Eight scene seeds cover seven layouts and six position-pair groups. Aggregate scores and intervals now weight those six groups equally. This is a post-publication correction; all videos and per-run scores are unchanged, and the original estimates remain in the linked analysis.
Analysis and original results (opens in a new tab)How we tested it — results, method & every run
Predicting simulated grasp outcomes
On a simulated WidowX robot, which model correctly predicts whether the carrot stays lifted from the same starting image and robot trajectory?
32 cases · 3 seeds · 3 compared configurations · completed 2026-10-16
Watch the carrot as the gripper closes at about 5 seconds and rises after 6 seconds. A correct prediction should match whether the simulator holds it above the table at the end.
| Model configuration | Outcome agreement% · higher is better | Readable outcomes% · higher is better | False successes% · lower is better | Missed successes% · lower is better | Generation timeseconds · lower is better | Run errors / runs |
|---|---|---|---|---|---|---|
| Cosmos 3 Edge | 74.552.7–93.16 groups · 95 scored runs | 98.695.8–100.06 groups · 96 scored runs | 37.512.5–61.16 groups · 45 scored runs | 2.20.0–6.75 groups · 50 scored runs | 8.28.1–8.36 groups · 96 scored runs | 0 / 96 |
| Cosmos 3 Nano | 77.955.2–95.06 groups · 89 scored runs | 94.090.7–97.26 groups · 96 scored runs | 29.87.3–54.86 groups · 41 scored runs | 2.20.0–6.75 groups · 48 scored runs | 10.09.9–10.06 groups · 96 scored runs | 0 / 96 |
| Frozen imagebaseline | 45.829.2–70.86 groups · 96 scored runs | 100.0No variation in resamples6 groups · 96 scored runs | 0.0 |