Checking a robot's plan · Robot simulation
Can the AI spot a plan that won't work?
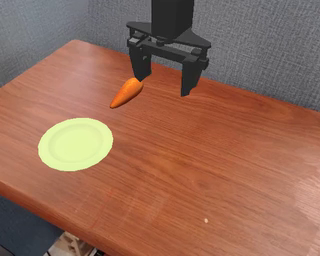
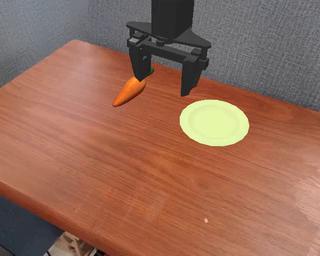
The same robot controller acts inside a simulator and two generated worlds. Compare how things unfold.
Every controller failed the simulator test, so we can't pick a better policy from this study. AI-labeled successes in generated clips remain unverified.
Same starting scene and controller; later actions can differ as each controller reacts to its own observations.
Clip files & individual measurements
Native simulator · reference-only
Placement failed under the matched block16 visual schedule.
Cosmos 3 Nano
NVIDIA
- AI-labeled success signals (unvalidated)
- 0.0 %
- AI-judged readable outcomes (unvalidated)
- 0.0 %
- World generation time
- 21.3 seconds
Cosmos 3 Edge
NVIDIA
- AI-labeled success signals (unvalidated)
- 0.0 %
- AI-judged readable outcomes (unvalidated)
- 0.0 %
- World generation time
- 7.4 seconds
Each clip shows one registered input and seed. The full study includes every seed and failure.
Look for thisFollow the carrot all the way to release. A convincing-looking move isn't necessarily a successful placement.
Every run, including failures (data file) (opens in a new tab)
Choose a scene or change the models
Examples stay in their registered order. Every seed and any failed runs remain in the full results.
Compare the numbers across every run
Cosmos 3 Nano − Cosmos 3 Edge. Uses every jointly scored case and seed for these two configurations, across the full study.
| Measurement | Left − right | 95% interval | Paired coverage |
|---|---|---|---|
| AI-labeled success signals (unvalidated)percentage points | +1.0 | -12.5 to +12.5 | 96 matched pairs6 groups · 0 excluded pairs |
| AI-judged readable outcomes (unvalidated)percentage points | -11.5 | -33.3 to +11.5 | 96 matched pairs6 groups · 0 excluded pairs |
| World generation timeseconds | +12.9 | +12.6 to +13.2 | 96 matched pairs6 groups · 0 excluded pairs |
A positive difference means the left model has a higher value; a negative difference means a lower value. Whether that is better depends on the metric. Excluded pairs include inapplicable or unscored measurements. These differences use matched runs and can differ from subtracting the displayed averages. Intervals that cross zero do not establish a clear direction of difference.
How we tested it — results, method & every run
Policies inside generated worlds
Can a learned visual world select a better fixed placement policy than a default policy, measured against held-out native simulator outcomes?
48 cases · 2 seeds · 2 compared configurations · completed 2026-10-16
What we found. All four policies failed all twelve native resets, so this cohort cannot establish useful policy selection. The automated judge called seven generated clips successful, but an agent audit flagged identity or release ambiguity in all seven. Inspect the matched rollouts; neither the tied reference results nor these unvalidated labels support a policy or world-model ranking.
Compare the native simulator rollout with both generated worlds on the same initial reset and fixed policy. Later actions can differ because each policy receives its own observations. Generated worlds use an approximate no-contact actuator and much slower visual updates than the 5Hz commands.
| Model configuration | AI-labeled success signals (unvalidated)% · lower is better | AI-judged readable outcomes (unvalidated)% · higher is better | World generation timeseconds · lower is better | Run errors / runs |
|---|---|---|---|---|
| Cosmos 3 Edge | 3.10.0–12.56 groups · 96 scored runs | 70.845.8–92.76 groups · 96 scored runs | 6.96.9–7.06 groups · 96 scored runs | 0 / 96 |
| Cosmos 3 Nano | 4.20.0–12.56 groups · 96 scored runs | 59.440.6–81.36 groups · 96 scored runs | 19.919.5–20.26 groups · 96 scored runs | 0 / 96 |
Means weight each seed and scene/group equally. Descriptive 95% percentile intervals use 2,000 crossed seed and group bootstrap draws, seed 202610320; cases remain nested within groups and paired differences use the same draws. An unscored seed/group cell withholds the balanced aggregate instead of silently reweighting it. Scored observations, excluded pairs and failures remain visible. Small cohorts and evaluator bias limit these intervals.
When every resample gives the same result, the interval cannot describe unseen successes or failures. No observed variation does not establish certainty.